Ponta Delgada
Readings load in your browser
- Wind
- —
- Gusting
- —
- Temperature
- —
- Visibility
- —
Find your Azores
Explore volcanic landscapes, choose a place to eat, and work out how to get there.
Conditions
In the Azores the weather, not the timetable, often decides whether a crater rim or a lake is worth the walk. These are the current readings at the two places most journeys pass through.
Readings load in your browser
Readings load in your browser
Live readings are unavailable right now. The guidance below does not depend on them.
These are measured weather readings, not a service status. We do not infer from a reading whether a bus is running; the operator’s timetable, linked from every line page, is the source for that.
Explore monthly climate and sea temperatures

Start with an official visual introduction to all nine islands, then explore São Miguel in detail.

See Furnas, Caldeira Velha, Sete Cidades and Lagoa do Fogo before planning a route across São Miguel.

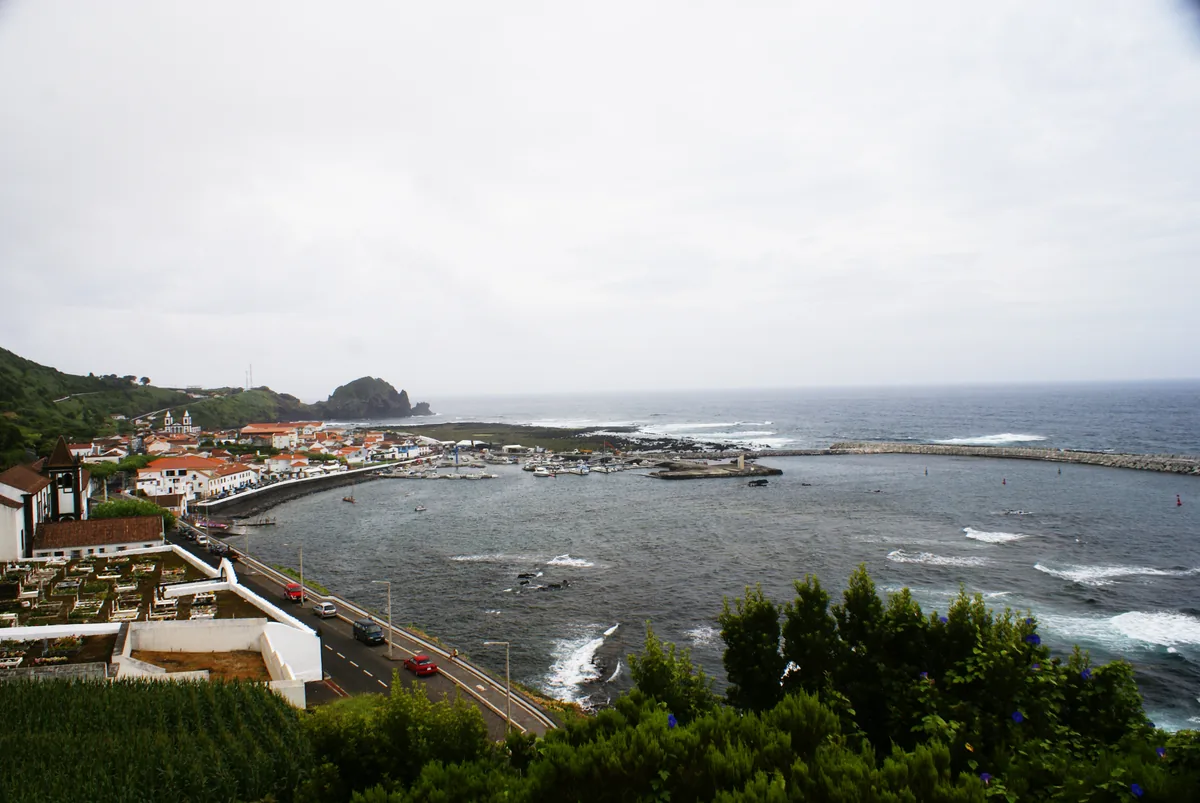
Take a visual look around Faial, including Horta and its volcanic coast, before choosing where to go.

Spend time with an independent São Miguel travel film before choosing your own lake and garden stops.

Follow Pico’s basalt-walled vineyards, mountain and coast on film before exploring the Lajido landscape.

See Flores from the air in this short island film, then use the place pages for trails and ground-level access.

This longer city film traces Angra’s streets and maritime history before a walk through its old centre.

Watch the official film about cozido cooked in the geothermal ground by Furnas Lake.

A short official film evokes walking across the islands; check the current trail page before setting out.
Monthly averages from the climate normals IPMA publishes for its three island observatories, read through Wikipedia on the date shown beneath the figure. They describe past years, not a coming one; the daylight row is astronomy, computed from latitude.
Daytime high Days with rain
Monthly normals at Ponta Delgada (Afonso Chaves Observatory): Daytime high (°C), Days with rain.
Daylight
Day length is computed from the latitude for the middle of each month.
| Month | Daytime high (°C) | Night low (°C) | Rainfall (mm) | Days with rain | Sunshine (h) | Daylight (h) |
|---|---|---|---|---|---|---|
| Jan | 17.5 | 12.7 | 102.1 | 13 | 97 | 9.8 |
| Feb | 17.4 | 12.1 | 87.2 | 10.8 | 103 | 10.7 |
| Mar | 17.9 | 12.6 | 97.1 | 11.7 | 120 | 11.8 |
| Apr | 18.8 | 13.3 | 79.6 | 10.2 | 141 | 13.1 |
| May | 20.2 | 14.6 | 61 | 8.7 | 174 | 14.2 |
| Jun | 22.4 | 16.8 | 44.4 | 6.6 | 163 | 14.8 |
| Jul | 24.7 | 18.9 | 26 | 4.8 | 208 | 14.5 |
| Aug | 26 | 19.9 | 45.8 | 6.5 | 213 | 13.6 |
| Sep | 25 | 19.1 | 78.2 | 9.4 | 175 | 12.4 |
| Oct | 22.6 | 17.1 | 118 | 13.7 | 142 | 11.1 |
| Nov | 19.9 | 14.9 | 95.3 | 11.8 | 109 | 10.1 |
| Dec | 18.3 | 13.4 | 152.8 | 15 | 93 | 9.6 |
Source: Instituto Português do Mar e da Atmosfera — Wikipedia, "Ponta Delgada", climate table (Weather box) · Normals 1991–2020 · read 2026-10-02 · CC BY-SA 4.0
Sunshine — Source: NOAA · Normals 1961–1990
Long-term averages from the published record. They describe a typical year, not a forecast for your dates.
Daytime high Days with rain
Monthly normals at Horta (Príncipe Alberto do Mónaco Observatory): Daytime high (°C), Days with rain.
Daylight
Day length is computed from the latitude for the middle of each month.
| Month | Daytime high (°C) | Night low (°C) | Rainfall (mm) | Days with rain | Sunshine (h) | Daylight (h) |
|---|---|---|---|---|---|---|
| Jan | 16.9 | 12.9 | 105.4 | 13.3 | 91 | 9.7 |
| Feb | 16.7 | 12.2 | 92.8 | 12.2 | 95 | 10.7 |
| Mar | 16.9 | 12.5 | 113.7 | 13 | 120 | 11.8 |
| Apr | 17.8 | 13.1 | 77.2 | 10.9 | 155 | 13.2 |
| May | 19.1 | 14.4 | 77.7 | 9 | 182 | 14.3 |
| Jun | 21.6 | 16.6 | 59 | 8.4 | 174 | 14.8 |
| Jul | 24.4 | 19 | 41.8 | 5.5 | 232 | 14.6 |
| Aug | 25.8 | 20.2 | 47.8 | 6.8 | 238 | 13.7 |
| Sep | 24.6 | 19.4 | 87.9 | 9.7 | 178 | 12.4 |
| Oct | 21.9 | 17.2 | 132.2 | 13.6 | 144 | 11.1 |
| Nov | 19.3 | 15.1 | 111.9 | 11.6 | 103 | 10 |
| Dec | 17.8 | 13.6 | 139.7 | 15.2 | 83 | 9.5 |
Source: IPMA — Wikipedia, "Horta, Azores", climate table (Weather box) · Normals 1991–2020 · read 2026-10-02 · CC BY-SA 4.0
Sunshine — Source: NOAA · Normals 1961–1990
Long-term averages from the published record. They describe a typical year, not a forecast for your dates.
Daytime high Days with rain
Monthly normals at Angra do Heroísmo (José Agostinho Observatory): Daytime high (°C), Days with rain.
Daylight
Day length is computed from the latitude for the middle of each month.
| Month | Daytime high (°C) | Night low (°C) | Rainfall (mm) | Days with rain | Daylight (h) |
|---|---|---|---|---|---|
| Jan | 16.6 | 12.5 | 102.9 | 12.8 | 9.7 |
| Feb | 16.5 | 11.9 | 90.1 | 11.3 | 10.7 |
| Mar | 16.7 | 12.2 | 105.4 | 12.4 | 11.8 |
| Apr | 17.6 | 12.8 | 80.2 | 10.1 | 13.2 |
| May | 19.1 | 14.2 | 77.1 | 8.2 | 14.3 |
| Jun | 21.5 | 16.4 | 50.6 | 6 | 14.9 |
| Jul | 24.2 | 18.6 | 27.3 | 4.8 | 14.6 |
| Aug | 25.5 | 19.7 | 40.9 | 6.4 | 13.7 |
| Sep | 24.2 | 18.9 | 84.3 | 8.2 | 12.4 |
| Oct | 21.6 | 16.8 | 115.5 | 12.8 | 11.1 |
| Nov | 18.9 | 14.6 | 103.7 | 11.7 | 10 |
| Dec | 17.4 | 13.2 | 154.4 | 14.8 | 9.5 |
Source: Instituto Português do Mar e da Atmosfera — Wikipedia, "Angra do Heroísmo", climate table (Weather box) · Normals 1991–2020 · read 2026-10-02 · CC BY-SA 4.0
Long-term averages from the published record. They describe a typical year, not a forecast for your dates.
Azores Bus
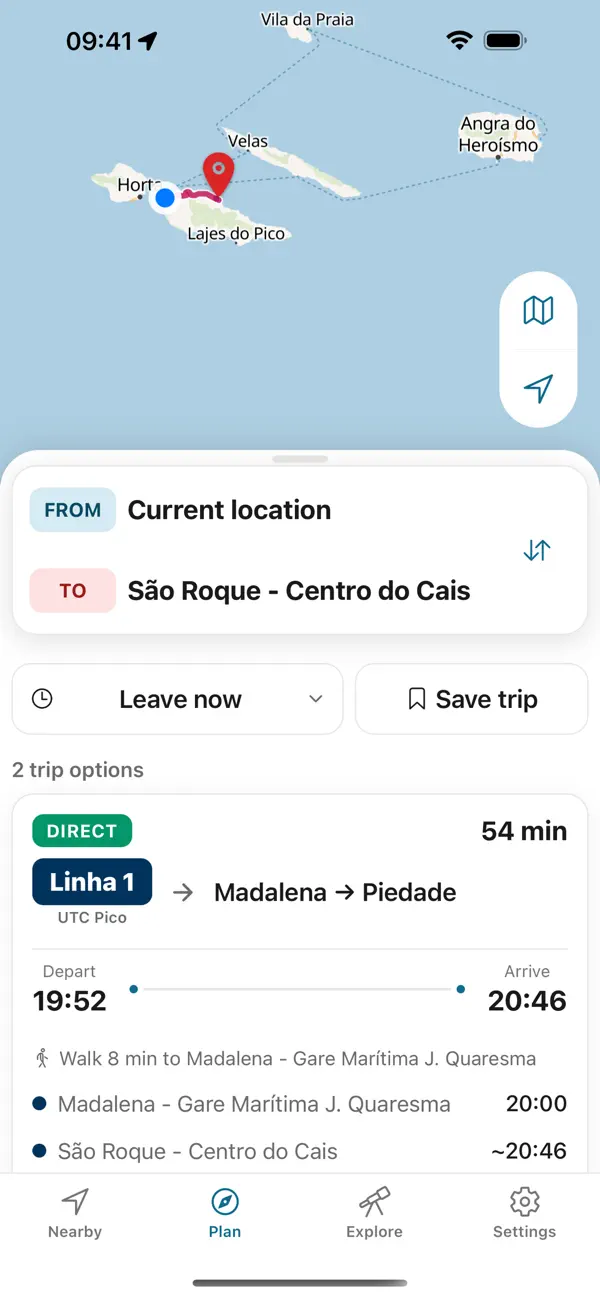
Plan the way back before you set out. Azores Trails warns that many trails have no mobile network except at the start and end; the app keeps every printed return on your phone, offline.


Independent app. No ticket sales or live vehicle tracking.